
May 2021
By Nathan Hart, Senior Consultant
Metrics that Matter: Quantifying the Right KPIs to Measure Campaign Effectiveness
Wineries leverage marketing campaigns to help retain current club members and drive new sales. Quantifying the impact of the campaigns driven by our churn and reacquisition models is just as important as the modeling, predictive analytics, strategy, and touchpoint design. Our reporting dashboards incorporate four important components that are designed to inform and instill confidence in the predictive models as well as quantify the client’s return on investment.
- Direct Campaign Impact (Incremental club members saved or acquired)
- Incremental Sales
- Model Performance
- Total Return on Investment
By looking at the impact of the campaign along with checks on our model performance and return on investment, we’re able to look at the impact of the campaign while considering our overall approach and effectiveness. This validates our value and allows us to fine-tune our models and perform better on future campaigns.
Direct Campaign Impact
Our campaign impact framework compares the touchpoints used in the campaign to a stratified and randomly sampled control group. We are able to look at how an individual campaign (email, postcard, phone call, etc.) performs versus the control group using KPIs like Sales per Target and Incremental Save Rate (for Churn) or Incremental Reacquisition Rate (for Reacquisition). Figure 1 below is an example of how we might illustrate the direct impact of particular campaigns over a control group. Because we design our control and target groups to have enough volume for statistical significance, the lift over a control group (no touchpoint) can be attributed to the touchpoint.

Figure 1: Stop Rate
Incremental Sales
It is also important to recognize that incremental saves or reacquisitions aren’t the only impact from these predictive models and touchpoints, although they are designed to prevent churn and reacquire former club members. It is common to see residual effects of the campaign in the form of a spend lift from those that received a touchpoint over the control group. It is not unheard of for this effect to continue to grow a few months after the touchpoint actually occurs.
Figure 2 below shows how a churn campaign for a winery in Washington state yielded higher levels of spend post-touchpoint compared to the control group.
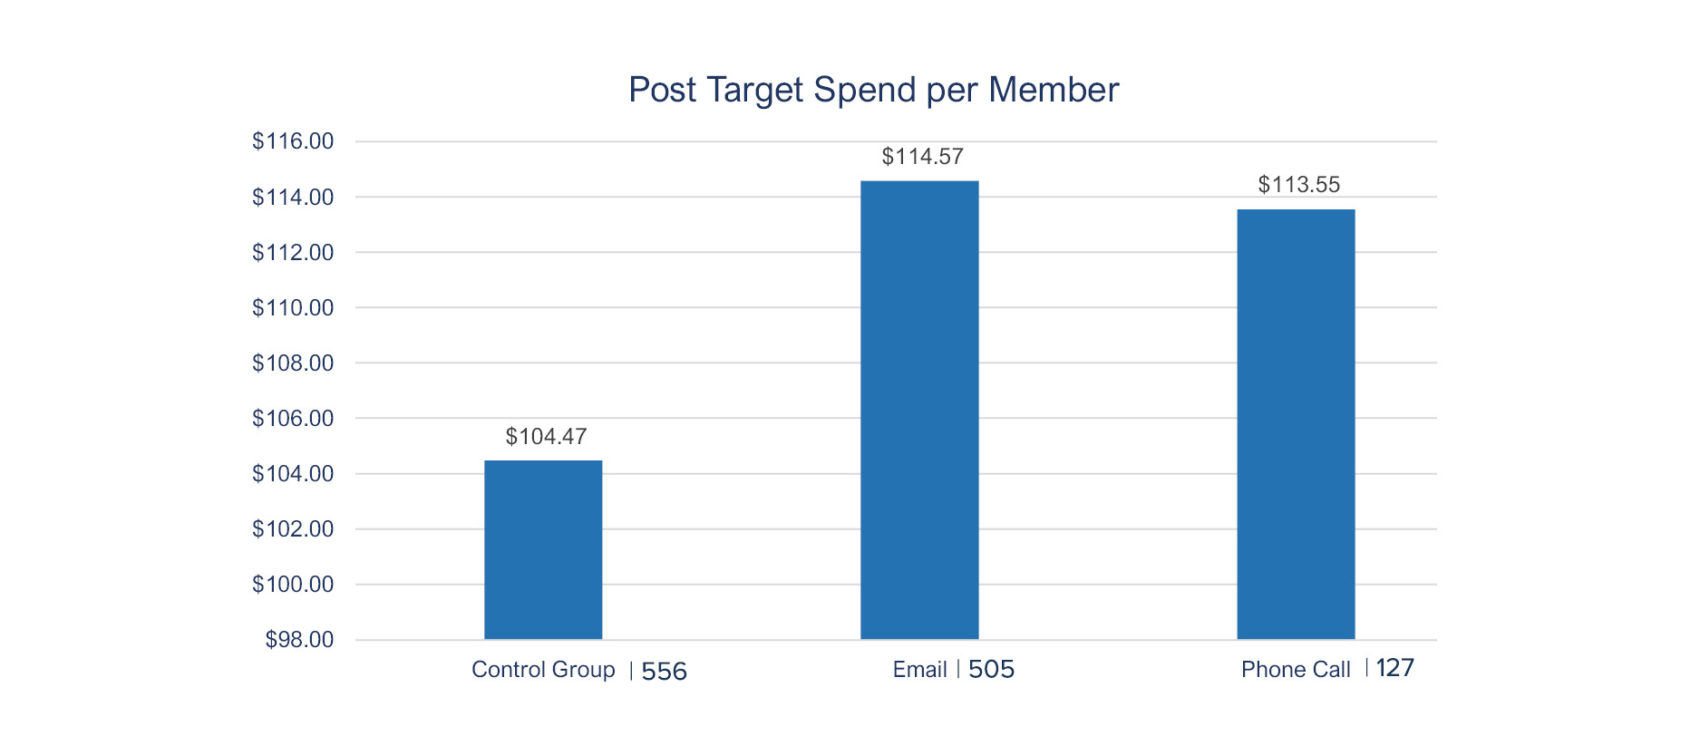
Figure 2: Post Target Spend per Member
Model Performance
Our model performance component looks at how our model-driven predictive analytics at the member level compare to how the members actually behaved. Indexing a winery’s club members and dividing them into quartiles by the predicted probability of churning or being reacquired allows us to build a matrix against the campaigns that check to see if the members we thought had highest churn probability (top quartile), for example, actually churned at a higher rate than the quartiles of members we thought had a smaller chance of churning. In figure 3 below, it is clear that the predicted churn probabilities assigned on active club members has the ability to predict likelihood of who will actually churn.
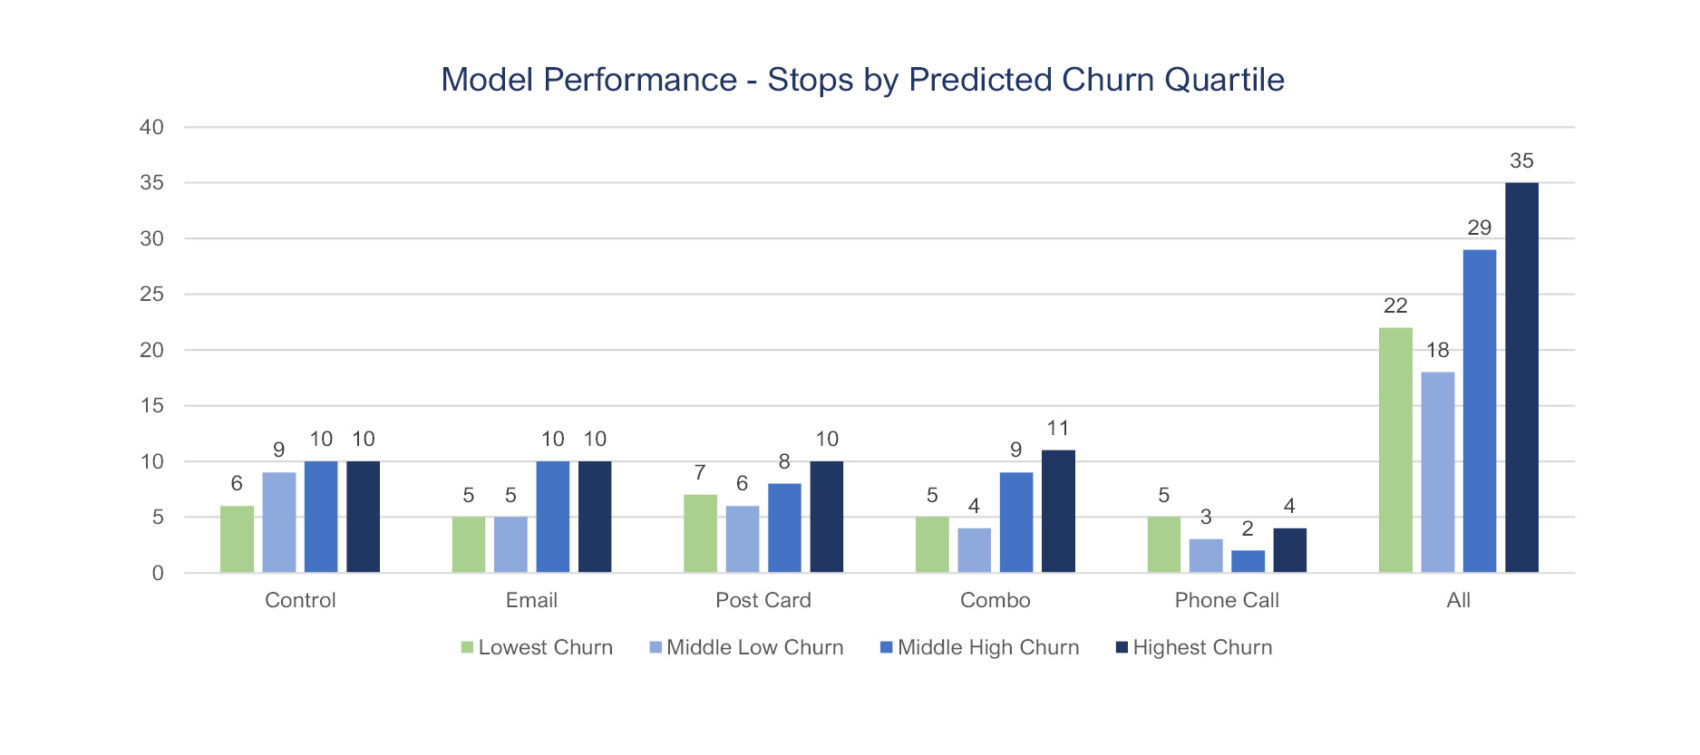
Figure 3: Model Performance
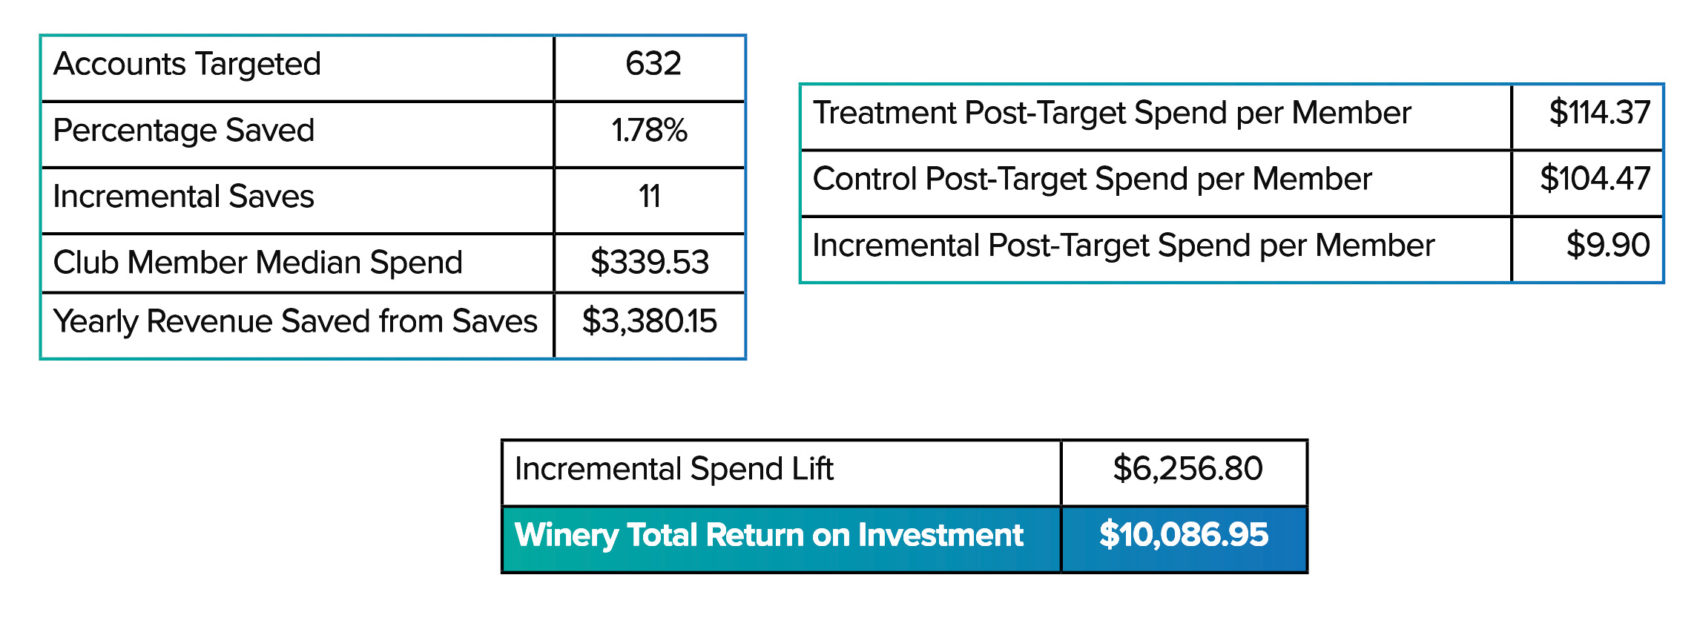
Winery Total Return on Investment
Ultimately the campaign and model performance are not adding value if the time and cost are not recovered by our efforts. Keeping this in mind, it is important to look at the observed impact and the forecasted impact of the campaign. As mentioned above, the combination of incremental spend lift and the direct campaign impact come together to quantify the total campaign impact.
To estimate the direct revenue impact (saves or acquisitions), we forecast the CLV of the incremental reacquisitions or saves, depending on the campaign. If, in a reacquisition campaign, we observed 17 reacquisitions from those in the target group and 2 from those in the control group, we would want to forecast the CLV of the 15 reacquisitions. By looking at median tenure of club members who come back and median total spend of club members with similar characteristics, we are able to estimate the long-run impact of the campaign.
Conclusion
The goal of marketing campaigns is to drive positive business outcomes, and the ability to precisely measure the impact of campaigns is imperative to refining efforts over time. An intuitive, all-encompassing reporting framework is important to not only illustrate the impact of specific churn or reacquisition campaigns but validate our models and our ability to provide a significant ROI.
For more details on wine pricing optimization, contact Nathan Hart or Matthew Lulay.