Click here for full downloadable article.
As online readership continues to develop in the 21st century, the media industry has had to adjust to new challenges and opportunities to spread their product via multiple platforms. At Mather Economics, we have been tasked with analyzing prior advertising sales data from various sources (print, preprint/inserts, and digital ads) in order to drive more efficient advertising rate cards. Our analysis looks at the fundamentals that make up each type of advertisement, what inputs factor into the price of a particular ad, and how we can apply our findings into actionable steps moving forward.
The data we received consists of advertising orders from three markets, containing the sale price of the ad, the run date, and various characteristics of the advertisement. We have chosen to focus on the three main advertising types (print, inserts, and online ads) independently, and began by diving into the traditional print advertisements that are displayed directly on the paper (i.e., run of print).
We found that many variables drive the price of a given ad, with the most impactful inputs as follows:
• The size of the ad (Full Page, ¼ Page, etc.)
• Ads in color vs. black & white ads
• Day of week during which the ad is run
• The customer category to which the ad belongs (Health, Real Estate, etc.)
Initially, we kept our scope limited to advertisements that ran in one of the three main papers only, meaning no special “Premium Day” sales were included. We also excluded any sales orders that contained special discounts and any “make-good” or “trade” sales. One further limitation in scope was to focus exclusively on local and regional sales, excluding national sales altogether.
Running a logistic regression, we found that the size of the advertisement was the single most influential predictor of an advertisement’s final sale price. Generally, the larger the ad, the higher the sale price. However, we discovered in all three markets that the size of the advertisement was not directly proportional to the cost. In fact, there was little to no difference in the sale price between Quarter-page advertisements and Half-page ads across each market analyzed, despite those two sizes being among the most popular in terms of total ads sold in our dataset.
Additionally, our results showed that Real Estate advertisements had some of the lowest sale prices, while those categorized as Health advertisements sold at some of the highest rates. Meanwhile, ads run in full color sold at about a 20% premium compared to those sold in black and white. The same can be said for ads that were to be run on a Sunday compared to those running on any other day of the week.
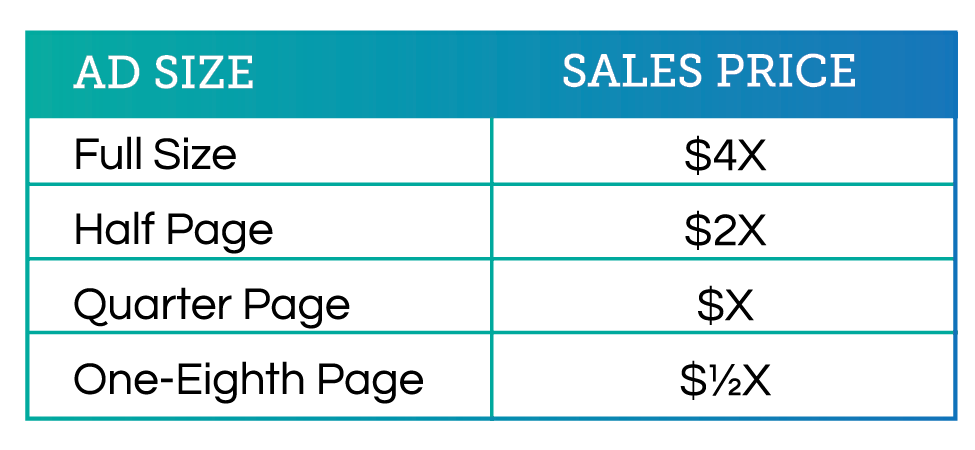
Considering these findings, we are running a relatively simple test that will help determine the value of ad space sold for a particular ad. It struck us that advertisements sold at vastly different sizes were being sold at roughly equal prices. Therefore, our proposal was a relatively simple one, to build out a rate table that priced advertisements proportional to the size of the ad. Therefore, a Half-page ad would sell for twice as much as a Quarter-page ad, etc. To determine the anchor point from which we would extrapolate the sale cost of each ad, we used the average historical sale price of the Quarter-Page ad, which was the most prevalent ad size sold across all markets. The net revenue derived from this ad size exceeded any other ad size in all three markets within the observed data, and was, in our estimation, the most robust price to use as a starting point.
Currently, we are running a pilot with our client to determine the efficacy and responsiveness to this newly structured rate table in each market, both from the viewpoint of the customer and the sales representatives selling these ads. While preliminary, results have proven insightful as to how this new proportional rate structure has performed. Our client assigned certain ad reps to work off of the new, proportional rate cards, while other reps were to sell under a “business as usual” approach. Furthermore, we broke out our reporting into a Pre and Post-Launch timeframe. This way, we could observe the sales patterns of the “control” reps before and after the launching of the test side-by-side with “target” reps who were selling off the new rate card.
The graphs below illustrate the percentage change in four metrics: volume of ads sold, the average sale price of each ad, earned revenue from these sales, and the overall success rate (close rate) of each ad rep overall. The numbers below indicate the percentage change after the launch of our pilot test for both groups of ad reps. It should be noted that while our test was focused solely on changing print sales rates, we wanted to observe the change in both print and online ad sales to see if there were any substitution or complementary effects from changing the overall structure of print rates.
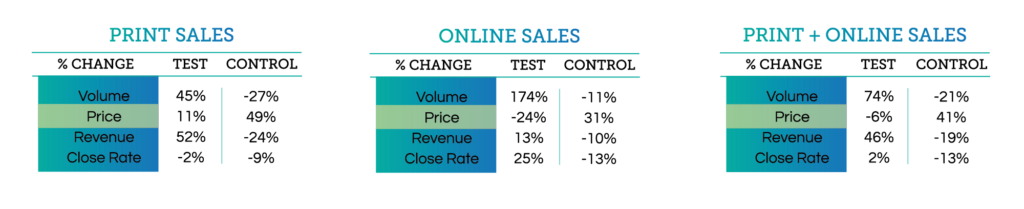
The charts above paint a very interesting picture. Our metrics highlighted in blue indicate that the percentage change in Volume, Revenue, and Close Rate within our test group Post-Launch were greater than the percentage change of the same metric within the control group. Conversely, the percentage change in the average sale price of ads in the test group was lower than that of the control group.
Conversely, the percentage change in the average sale price of ads in the test group was lower than that of the control group. The same shifts held true when observing Online sales, though there was no direct change to the way those sales were priced. This indicates to us that Print advertisements and Online ad sales are indeed complimentary goods; a change in price for one of these goods is likely to shift not only the quantity sold for itself, but its counterpart as well.
Though we are still in the discovery phase for testing preprint advertisements, also known as “inserts,” we have found some insightful takeaways form our early analysis. We found that many of the inputs that helped us to determine the estimated sale price of a print advertisement held true for preprint ads as well, with a couple differences. The customer category and day of week that the ad was inserted still held true in providing explanatory power as to the price of the ad. However, due to a lack of overall variation, we no longer considered whether an a d was sold in black & white or color, as 99% of preprint sales in our dataset were sold without color.
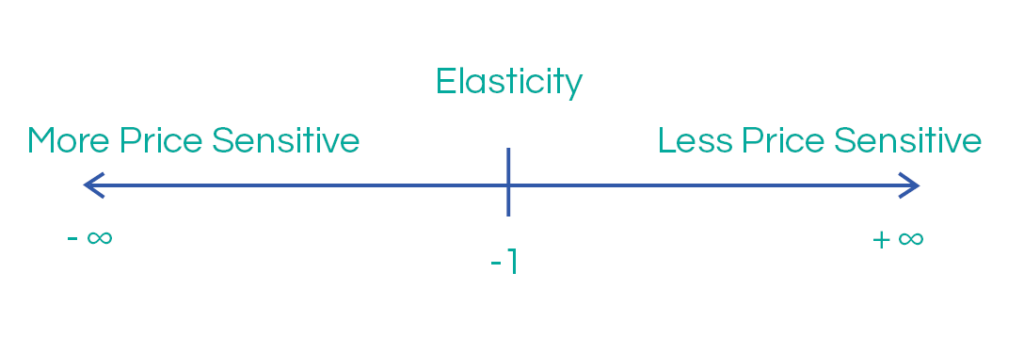
Due to the nature of how preprint ads are sold, often in large batches (many thousands at a time), the data we received allowed us to perform a fairly clean analysis of the responsiveness to different prices for this product, known as a product’s elasticity. Simply put, the elasticity of a good reflects the percentage change in quantity given a percentage change in price. Any good that has a percentage change in quantity less than its percentage change in price (Elasticity greater than -1) is said to be “inelastic,” meaning consumers are relatively insensitive to the price change, resulting in more predicted revenue at a higher price.
By utilizing a log-logistic regression and holding various characteristics of these preprint sales constant, we were able to estimate the overall elasticity of these ads in each of the same three markets we analyzed previously.
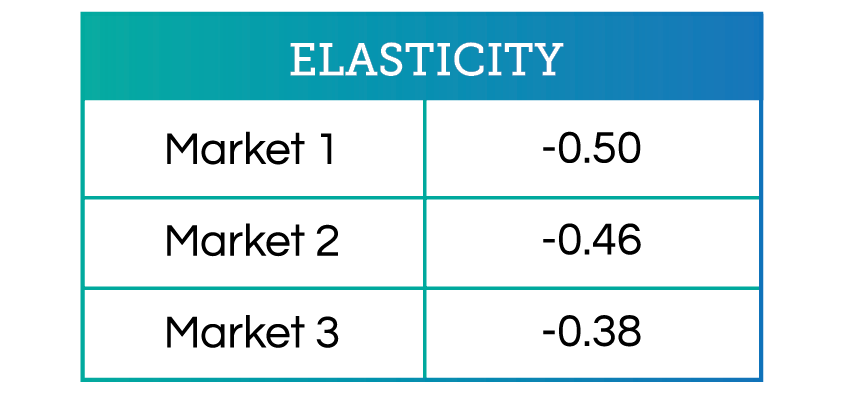
Overall, the three markets in our analysis all showed that the demand for preprint ads are relatively inelastic in relation to the past sale prices we’ve observed in the dataset. We can note that Market 1 is circulated in a metro area where they have direct competition with another paper, so it makes sense that preprint ad customers would be more sensitive in this market. Sensitivity was lowest in Market 3, which, predictably, is the market with the lowest levels of direct competition.
To conclude, our analysis of advertising in the media industry have shown results that are both promising and intriguing, though much of our analysis is still ongoing. Our next steps will hopefully consist of a test for preprint rates so that we can observe how changes in price affect sales going forward. Whether results of such a test will confirm or contradict our prior analysis is yet to be seen and will hopefully prove fruitful for actionable steps to be taken down the road. Moreover, our continuing observance of how price changes within certain ad types will affect sales in related areas will be something we continue to monitor and report on in the future. With the rate at which online advertising continues to evolve, we will almost certainly have new and exciting findings to uncover down the road.