By Matthew Lulay, Managing Director
The Economics of DtC Wine Pricing
The leadership at many small to midsize wineries around the United States wear many hats. On any given day, a general manager may be helping to manage tasting room operations, preparing invoices, making deliveries, reconciling financials, creating marketing materials, or even helping out in the vineyard. As such, pricing is often given less attention than it deserves. We have heard from our partners that pricing is usually driven via the “gut feel” approach, where high level and imprecise discussions around “How is the economy doing?” or “What are my competitors doing?” drive the pricing decisions at many wineries. For many wineries, this type of approach has led to perennial sellouts for some brands while others require deep discounting from retail prices to move product.
By leveraging the wealth of first party data wineries already own, considerable revenue opportunity exists for those willing to analyze the economics around their brands. We will briefly examine a “Price Discovery” approach to estimating efficient pricing for wineries below.
Price Discovery for Wineries
Simply put, price discovery is the process of estimating the appropriate price for a good or service through an analysis of its market supply and demand. Generally speaking, the goal of any firm is to set pricing at a level where the supply of the good being produced is “cleared” by the demand for that good. This intersection of supply and demand is often referred to as the “Equilibrium Price” in economics.
For wineries, if prices are set above the equilibrium price for a given brand, excess cases will go unsold, requiring discounts to avoid costly storage of unsold inventory. If prices are set below the equilibrium price, inventory quickly sells out, additional revenue is left on the table, and many potential buyers that missed out may explore competitor offerings. Figure 1 below shows a simplified market for a sample wine brand, with price on the y-axis and quantity and the x-axis.
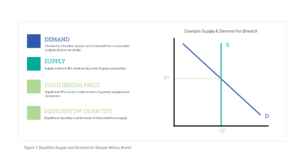
The supply curve indicates the amount of a good that is produced at various price levels. Unlike some other industries that can quickly respond to market signals by increasing or decreasing production, most wineries have a “sticky” supply curve in the short to medium term, as modifying production levels requires planting more of a certain variety, substituting acreage between varieties, or purchasing grapes on the open market. With any of those scenarios, there is a lag time for the production changes to be realized in the retail market, as the wine needs to be properly aged and conditioned, which for many varieties takes many months and years.
The demand curve represents the quantity of cases or bottles demanded by the market for a given brand at various price points. The demand curve for normal goods is downward sloping, as less quantity of a good is demanded at higher price points, and vice versa. Understanding the shape of the demand curve for a good is important for firms, as it indicates the sensitivity to sales quantity for a given change in price. In other words, it helps wineries understand what will happen to sales if they make changes to pricing. A steeper demand curve indicates lower sensitivity to price changes while a flatter demand curve indicates higher sensitivity to price changes. While the demand curve in Figure 1 is linear (constant slope), in reality, for most firms the demand curve takes on a non-linear shape with different slopes at points along the curve. At Mather, estimating the shape of these demand curves is our primary focus in helping wineries price more efficiently, and we have developed an approach, using winery first party sales data, to do just that.
Estimating the Demand Curve
Most wineries have a robust database of historical sales available for analysis, which includes line-item detail on SKUs, quantities, prices, shipping, taxes, and club member attributes. This time series data lends itself well for use in predictive models that can be leveraged, in this case, to estimate the relationship between price and quantity demanded for wine. For the purpose of estimating the shape of demand curves for winery brands, we leverage an econometric approach, structured to predict the quantity of wine demand as a function of the net bottle price while controlling for other relevant factors that can account for changes in demand. Figure 2 below shows some of the variables included from one of these models for a Syrah from a sample winery.
We use three general types of variables to help predict the quantity demanded for Syrah: winery-specific, industry vertical, and macroeconomic.
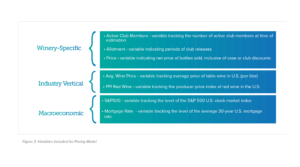
The “Price” variable is the key input of interest and allows for an estimation of the relationship between the net price of Syrah and the quantity demanded while controlling for the other factors in the regression noted above. The industry metrics and macroeconomic indicators allow us to measure the impact of broader economic conditions on the demand for a winery’s goods. Once these models are estimated for a winery’s portfolio, the demand curves can be drawn. Figure 3 below displays the demand curves for a sample winery portfolio.
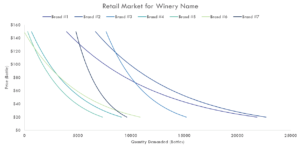
Figure 3 – Demand Curves for Winery Portfolio
The slope of the demand curves indicates the degree of price sensitivity at various price points. Once the demand curves are generated, we can estimate the price elasticity at the current price point and make analytically-driven recommendations for optimizing revenue. Figure 4 displays the pricing analysis snapshots for three sample brands.
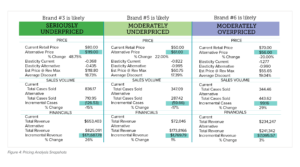
In these examples, the model output indicates two of the sample brands are underpriced, with Brand #3 and Brand #5 currently priced 49% and 22% below what is recommended, respectively. Brand #6 is estimated to be moderately overpriced by 20%. Brand #3 in Figure 4 currently sells for $80 and perennially sells out quickly upon release. The difference in the current price and the recommended price represents a six-figure revenue opportunity for this winery.
In conclusion, wineries are sitting on a wealth of actionable data that can quickly be run through analytics engines to support a variety of DtC operations, including churn reduction, reacquisition, and pricing. As seen above, the revenue opportunity from adding analytical precision to pricing decisions within wineries is significant, and Mather’s toolset for wineries is custom built to bring these insights to the forefront so leadership at wineries have the information available to make data-supported decisions.