INMA Blog by Matt Lindsay
Posted on March 6 on INMA.org
Content Lifetime Value – Content can be valuable for different reasons
For the INMA digital retention master class series, I shared data from some of our recent work with publishers on content economics. An interesting finding from this work is that the content that is effective for attracting new digital subscribers is often different from the content that engages subscribers and retains them as customers.
In our analysis of content, using our Listener™ data capture tool, we track the path to conversion (PTC) for digital subscribers. Any article or content item that they read prior to subscribing gets some attribution for that subscription conversion. This avoids giving too much credit to the content item they were reading when the subscription takes place. Also, we find that approximately half of new subscribers come from channels other than a paywall, and the customers that do subscribe through a paywall often reach the paywall many times prior to subscribing. For these reasons, we find the PTC method more accurate in measuring the contribution a content item towards acquiring new subscribers. In a future blog post, we can describe our findings on PTC in greater detail.
When we analyze content for retention value, we look at the content consumed by subscribers, which is often very different from the content consumed by the non-subscriber audience. The type of content that subscribers read is different in markets depending on the local culture and community. For instance, high school sports is one topic that can be important in one community and not in another.
For these analyses, we combine subscriber data, both print and digital, with data on site traffic and advertising impressions from Listener™. Retention is highly correlated with engagement, often measured using data on the volume of content, the time spent consuming the content, and pattern of consumption activity across digital platforms.
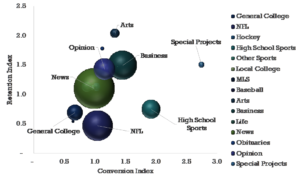
In the chart below, we have plotted content sections on two axis, the horizontal (X axis) shows the conversion performance of content, and the vertical (Y axis) shows the retention index of content. The size of the bubbles show the volume of page views consumed by section. For this US metro newspaper, Sports (NFL and High School) index higher on acquisition than retention. Business, Opinion, Arts, and Special Projects index highly on retention and acquisition.
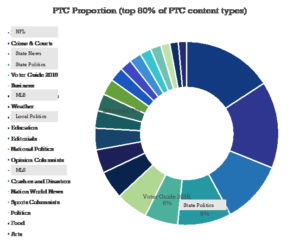
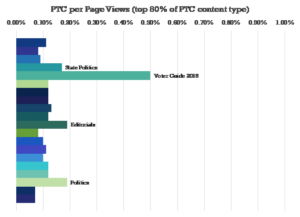
In the three charts below, we share data for another large US metro Newspaper. The first chart gives the volume of PTC credit by content section. The second chart shows the ratio of PTC to page views for each section. (Section titles were changed for those topics that would identify the market, and these appear in gray boxes.)
Politics and Voter Guide Content index high path to conversion (volume and ratio). Crime and Courts is the second-highest path to conversion by volume but shows a lower than average ratio of conversions to page views.
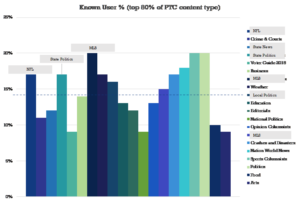
In the third chart for this market, the percentage of page views consumed within each section by known users is plotted. Known users includes registered customers in addition to digital subscribers in this analysis.
NFL Coverage shows a higher engagement from existing known users than from new conversions. Surprisingly, the special section on the election, their 2018 Voter Guide, does not attract a high proportion of known user engagement. State Politics performs strongly on both acquisition and retention. Major League Baseball shows a high proportion of known user engagement.
So, what to do?
The recurring conclusions from these content analyses is that publishers should understand what types of content are important to their subscribers and allocate resources to these areas even if they do not rank highly across all of their digital audience. One publisher, A-Media in Norway, goes so far as to drop all data from fly-bys (one-page view per month customers) in their newsroom metrics to avoid the problem of prioritizing content that only gets this type of traffic.
Another finding is that content that drives passionate reactions from readers will often drive subscriptions, but content that fosters habits and an ongoing relationship is what will keep them. The famous “Trump-bump” got many to subscribe to digital news products. It is up to those publishers to give subscribers a reason to stay after Trump is gone.
For article, click here.