How to evaluate the success of your subscription model (before optimizing)
Written by: Madeleine White, Editor-in-Chief of The Audiencers / Head of International at Poool
Key insights from our webinar with Poool
Poool and Mather Economics brought their expert heads together for an online event covering how to evaluate the success of your subscription model, providing exercises, strategies and key metrics.
The goal here is to help news publishers establish a 360 view of your digital subscription model so far, understanding your position both in the market and on the (arguably endless) journey to digital transformation. With this knowledge, you’ll be able to make more informed decisions to build solid foundations, optimize your strategy and continue to develop without walking before you can run.
You can catch the replay here, or continue reading for the key takeaways from the first half of this online event.
1. Evaluating your overall subscription model
Digital maturity compared to others in the industry
At Mather, digital maturity is defined by evaluating performance in terms of digital revenue (B2B & B2C advertising) and Digital Subscriber Penetration (the number of subscribers divided by monthly average users – i.e. how many of your pageviews are from subscribers?).
The New York Times, for instance, is one of the best in class, and should even be far outside of the quadrant pictured below. Most publishers, however, are still in the lagging and gaining part – especially in the US and Europe, although Nordic publishers are considerably more mature, often placing in the leading stage. We also see differences between regional vs national titles, and different publishing types (e.g. B2B, lifestyle, press, digital natives, etc.).
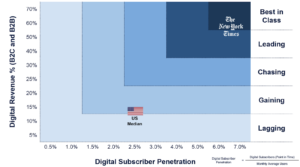
Image: courtesy of Mather Economics
Revenue diversification progress
How many articles should you offer for free before the paywall? Should you use a hard, metered or freemium model?… It depends greatly on the trade off between various revenue streams, particularly advertising vs subscriptions.
Those at the initial stage of their move to digital will be more dependent on advertising revenue, whilst pioneers have over 50% revenue from digital subscriptions.
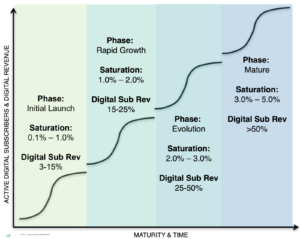
Image: courtesy of Mather Economics
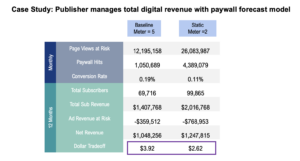
For example, if we put the baseline meter at 5 articles for free, you may well have fewer subscribers but you’ll also have fewer page views and ad revenue at risk. However, with a static meter at 2, you’ll have more subscribers but higher ad revenue at risk, and significantly more page views at risk.
Content strategy – progress in moving to a subscription mindset
It’s also important to adapt your content funnel and editorial strategy to the revenue model and trade off, aligning the newsroom to business goals.
Specifically, whilst some content will be valuable for top of the funnel (acquisition and reach), with the KPI of “pageviews”, other content will have the role of fulfilling your journalistic mission (mission journalism) or as bottom-of-funnel content, with the role of converting and retaining subscribers.
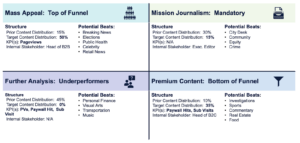
Image: courtesy of Mather Economics
A valuable exercise to get started on aligning the newsroom and business teams is to study all content published over a specific period, analyzing the performance of each article in terms of both page views and conversions. Bringing the two together, you can then place articles on a chart to discover which content performed well for just one, both or neither metrics, putting the work into improving the value of each article produced.
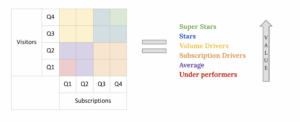
Image: courtesy of The Audiencers
Evaluating your conversion funnel
Going more in-depth into the user funnel towards subscription, we recommend dividing the single “conversion rate” metric into 4. The goal here is to better understand exactly where you’re losing readers in the funnel as well as more accurately comparing yourself to others on the market at each step.
- Step 1: out of your total traffic, how many users visit a premium article (one that’s blocked by the paywall)?
- Step 2: out of these users on a premium article, how many actually see the paywall?
- Step 3: out of total paywall views, how many users click on the paywall?
- Step 4: how many users convert via the paywall?
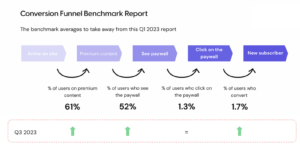
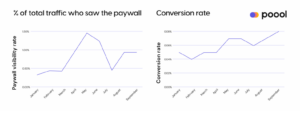
Data above is from Poool’s Conversion Funnel Benchmark Report Q1 2023 (more recent editions are reserved for clients only), but the arrows below indicate movement since then. What this shows is that publishers are gradually becoming more mature in their digital subscription models, producing more premium content, increasing the visibility of these articles and thus paywall hit rate, which naturally cumulates to increase the overall paywall conversion rate.
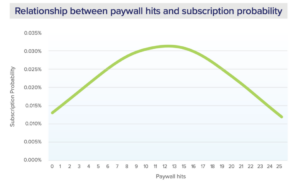
One key finding of the report is the correlation between paywall hits and conversion rates, as demonstrated by this publisher’s data:
Mather supports this, with data suggesting that subscription probability increases with paywall hits but to an extent. It’s therefore important to not only increase the visibility of your paywall, but also work on other strategies to engage the reader and convince them of the value of your premium offer.
An important question, therefore, is how many articles to offer for free before presenting the paywall?
Well, it depends on your strategy (sorry!)…
Nikkei, the Japanese publisher with 2.4M subscribers, integrated a registration wall into the user journey prior to subscription, offering 10 articles for free per month. This led to a 10X increase in conversion rates.
But conversion rate (CR) to subscription was still lower than expected and the team found that most users didn’t use up the quota of free articles available, so were never exposed to the paywall (i.e. paywall hits were low).
They therefore tested reducing the number of free articles per month from 10 to just 1, leading to a 20% increase in CR.
Key takeaways to run similar tests yourself:
- Number of paywall hits is an essential metric, but there’s a balance to be found between frustration and engagement
- Average page viewed per month is an essential metric, but should also be considered per audience segment to develop adapted metered models based on a reader’s level of engagement
- Analyze user needs to consider which content is best at converting. With this, you can ensure you block the right content that convinces a reader of your value
- Consider registration as a stepping stone towards subscription with the goal of increasing propensity to subscribe
- Don’t just copy this strategy: make your own, data-informed decision
- An intelligent model is the optimal solution for more mature publishers as it allows you to adapt to your audience and balance various business goals