Mather’s Benchmark reports shed light on recent media trends, insights

Updated: January 19, 2022

Mather Economics will release its fourth quarter 2021 Benchmarking Reports by the end of the month.

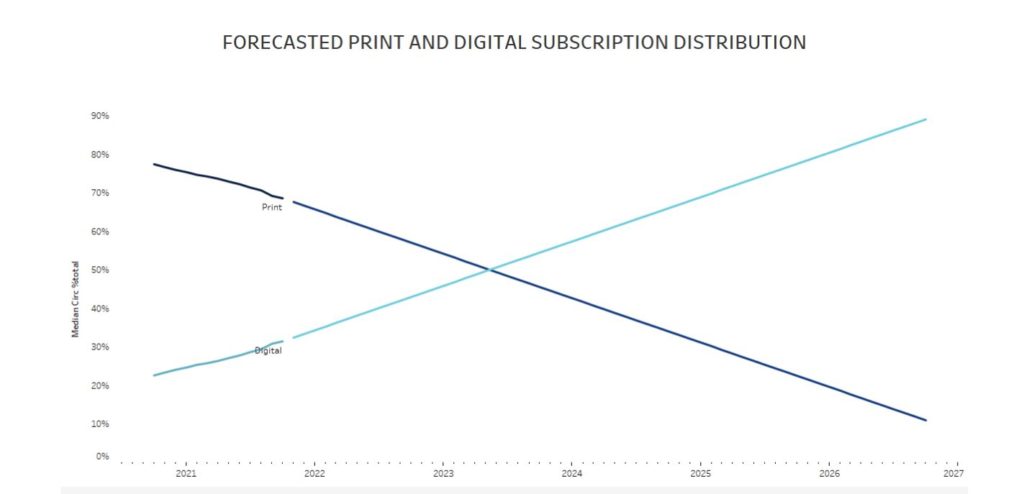
These Benchmarking Reports contain over a year’s worth of subscriber data, reported weekly, for digital only and hybrid (print + digital) subscribers from over 300 newspapers.  In the Q3 2021 Report, Mather predicts how print ad digital subscription will be distributed until 2027. Our findings suggest:

  • Digital only subscriber should exceed their print (including all-access) counterparts at some point between 2023 and 2025.
  • Raising rates on digital only subscribers will be critical to maintaining a robust revenue base.
Snapshot of Forecasted Print and Digital Subscription Distribution 


For more information on how to receive these reports, connect with the pricing experts at info@mathereconomics.com.

Let us help you on your print to digital subscription journey.


By Matt Lindsay, President of Mather Economics
INMA | 09 November 2021  |  3-min read

Mather Economics has released our two benchmark reports on subscribers and digital audiences for the third quarter:

  • The subscriber report includes over 50 metrics on digital and hybrid subscribers from over 300 newspapers in North America.
  • The digital audience report includes metrics for digital subscription sales funnels, subscriber engagement, and content consumption from over 100 publisher websites. Website data is captured using our Listener™ first-party tracking pixel.

Growth in digital subscription volumes and top prices were the most significant trend in the recent quarter.  More than 58% of new subscription sales are digital-only products, and digital-only subscribers comprise about 31% of total paid subscriptions. While digital subscriptions are growing as a share of total subscribers, less than 12% of audience revenue is from digital-only customers due to significantly lower prices for these products.

The average rate of digital subscriptions is US$9.35 per month, compared to US$31.13 for print plus digital subscriptions. One reason for the lower digital rate is the higher proportion of newer subscribers on promotional offers. We are working with many publishers to test higher top prices for digital-only products and targeted renewal pricing strategies.

Mather recently summarized our tests of digital-only renewal price elasticity for 157 North American news media companies using data from 249K digital subscribers, and we find considerable pricing power for publishers’ digital-only products.

These tests have yielded interesting insights into how changes in the drivers of renewal price elasticity, including digital engagement, subscription tenure, customer age, and acquisition offers affect customer’s responses. A few of these insights are shared in this post.

Our research into digital subscriber revenue optimization is ongoing, and we will continue to share these insights with our clients.


Digital subscriber retention by offer and channel

The chart below illustrates retention of subscribers for different acquisition prices. The findings are consistent with hybrid subscriptions, where customers who pay more for their subscriptions initially retain longer than subscribers acquired on lower rates.  We observe lower retention for customers who purchase their subscription from premium articles compared to customers who come from other channels, including the metered paywall. 

We recommend publishers consider alternative onboarding journeys for new subscribers given the nature of their subscription offers and the channel they are acquired from.

Retention and price elasticity by age group

Another factor that affects retention and price elasticity of digital-only subscriptions is the age of the subscriber. Interestingly, older subscribers to digital-only products have higher base churn rates than younger subscribers, which is contrary to traditional print subscriptions.

However, we observe lower renewal price elasticity for older subscribers than younger subscribers, which is consistent with print subscriptions. These data are from A/B tests of price changes on digital-only subscriptions that have been active for at least six months.

Control stops in the table below are the percentage of customers that did not receive a price increase that stopped during the test period. Price elasticity is the additional percentage of stops from the group of customers that received the price increase divided by the percentage change in price. 

Why are digital starts lower in 2021?

Many publishers had lower digital-only subscription sales early in 2021. Our analysis finds that the fall in new digital only starts is due to a reduction in “top of the funnel” volume from reduced site traffic.

The chart below shows how the metric “total conversions per 1 million unique users per month” has changed over the past year. This chart indicates that average monthly unique users has declined while the rate of new subscription sales per million visitors has stayed constant.

This metric includes new digital subscriptions from all sales channels, not just the metered paywall. The median value of this metric is 388 digital starts per month for every 1 million unique visitors.

Top performing publishers average over 600 starts per million visitors, and we work with a few publishers that have over 1,000 starts per million visitors per month.  These publishers are actively analyzing which content is most effective at converting users to digital subscribers, and they produce more of that content and market it effectively.

Don’t hesitate to connect with Matt Lindsay and the experts at Mather Economics to help you on your print to digital subscription journey.


Optimize your data. We’re here to help.

Subscribe to our newsletter!