
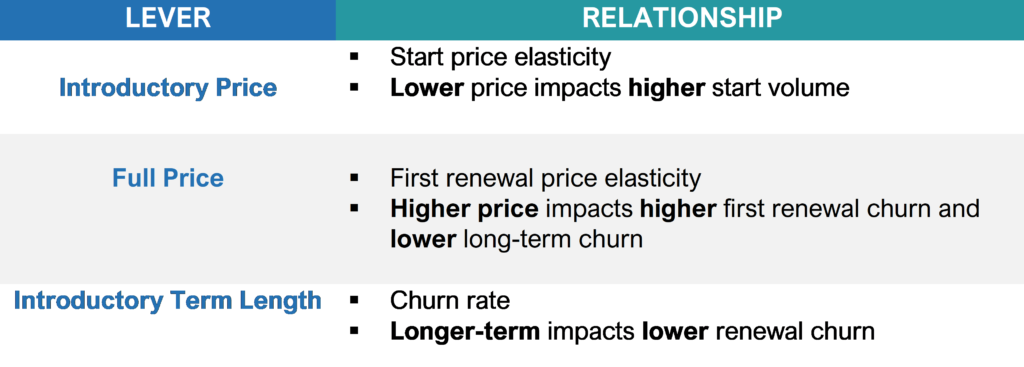
These levers, relationships impact the lifetime value North Star
SUMMARY: Media decision-makers should quantify monthly start volume based on paywall settings, price elasticity, and churn.
By Nick Truitt, Arvid Tchivzhel and Matt Lindsay
INMA Satisfying Audiences Blog
May 16, 2022
We made a strong case for using lifetime value (LTV) as your North Star in a recent blog post. Here, we present benchmarks and methodology on digital subscription offer optimization, stemming from extensive economic modeling and A/B testing of subscription offers and audience segmentation. We focus on the framework and inputs/outputs of the model. Decision-makers need to understand what levers are controllable and what relationships are important to measure.
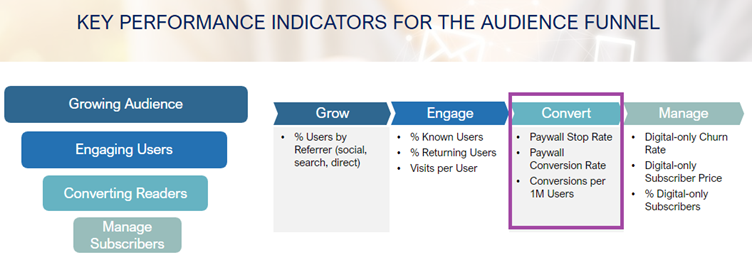
There are three key relationships to quantify: monthly start volume based on paywall settings, price elasticity, and churn.
Monthly start volume based on paywall settings
The paywall conversion rate (percent of subscribers who convert from hitting a paywall) and the paywall hit rate (percent of unique users who encounter a paywall) are inversely correlated. As sales attempts increase from tightening the paywall, the paywall conversion rate will decline. However, conversion volume typically increases when the paywall is tightened.
Many publishers generate 50% of starts from sales channels other than the paywall, such as the “subscribe” button or e-mail/newsletter campaigns. As paywall rules tighten, there is more cannibalization between sales channels, so the conversions attributable to the paywall replace some of the conversions attributable to “voluntary” (where the customer initiates the purchase) or e-mail channels.
In the offer optimization framework, we hold the paywall business rules constant as it is an indirect input to the model. Basic conversion funnel management tracking allows you to anticipate changes in start volume based on unique users, meter settings, percent of the content set to premium, and impact of voluntary and e-mail sales channels. Understanding these concepts establishes your conversion baseline.
Price elasticity
There are three price elasticities to measure: introductory price, first renewal at full price, and the ongoing renewal price elasticity after the initial introductory and first renewal (usually more than six months from subscription start).
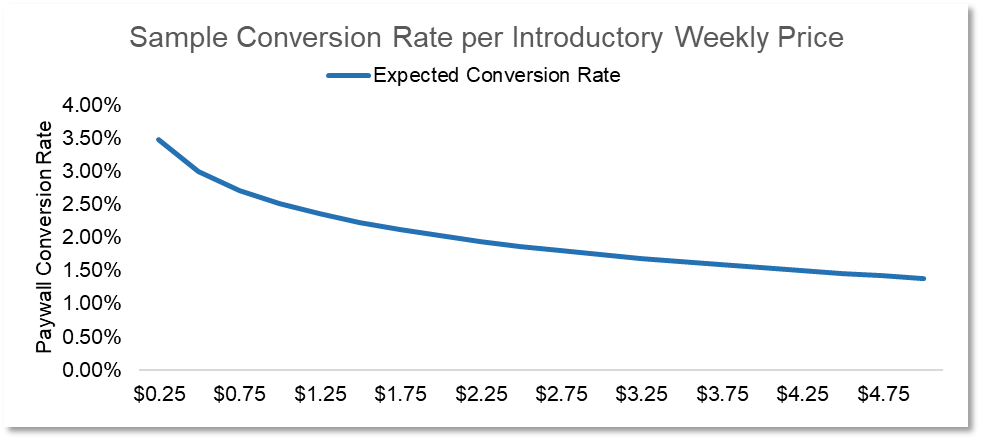
Though there are several caveats, benchmark data suggests introductory price elasticity is between -1.0 and -2.0 (meaning new customers are relatively price-elastic), depending on how attractive the discount is relative to the full price. Your current start price and start volume also impact introductory price elasticity, so make sure to measure your start price elasticity closely through A/B testing before applying the benchmark stated here.
The price elasticity from introductory price to first renewal at full price is measured to be very low (elasticity below -0.05). At this stage in the customer life cycle, an aggressive renewal after trial shows little risk. This phenomenon is why the well-known pricing strategy pioneered by The Boston Globe (US$1 for six months and renewal to US$1 per day) has been successful and adopted by many publishers across the United States.

Lastly, ongoing renewal price elasticity after the initial introductory period and first renewal is key for managing long-term value and volume. Mather has pioneered subscription pricing management for two decades, and most publishers have adopted our market-based pricing model for digital-only subscriptions as well. Benchmarks indicate renewal price elasticity averages -0.25, though of course this depends on how many subscribers are paying near the top price point and business rules (such as the days since the last increase and frequency of increase per year).
Churn
Price elasticity and churn are closely related. As expected, churn grows significantly after the initial introductory period and stabilizes after the first renewal.
When measuring churn or retention, it is important to differentiate between new versus tenured subscriptions. Our benchmarks show churn at first renewal rises to 16% as subscribers complete their introductory period. Our most recent benchmark report indicated overall digital-only subscriber churn rate is 2.88% per month, though best-in-class publishers achieve a 1.97% churn rate.
Now that the key inputs and relationships have been measured, the key question is: What levers can be pulled by the publisher to utilize this data when developing a go-to-market offer?
Key levers
The key levers that are relevant for a go-to-market offer are:
- Introductory price: This is the initial price a customer will pay to purchase a subscription. As expected, the main impact of introductory price is start volume based on measured start price elasticity. Certainly, the difference between the introductory price and the full price will also impact churn indirectly.
- Full price: This is the stated list price and likely the first renewal price after the initial introductory period. The difference between introductory and full price will impact churn upon renewal as well as the long-term churn rate.
- Introductory term length: The introductory term is the length of time you are willing to allow discounts against the full price. For our purposes here, we assume paid offers rather than free trials for the introductory price and term. Free trials attract a different type of consumer with vastly different benchmarks and performance. Our general recommendation is to avoid marketing “free trials” but rather pivot to implementing a robust registration wall strategy that aligns with your broader LTV and subscription goals.
A summary of the levers and relevant relationships.
Look to the future
Of course, there are many other factors that determine your strategy, such as market saturation and opportunity, content strategy, print and product tier evolution, and where your organization is in its digital transformation journey.
The framework of levers and relationships allows marketers and pricing leaders to use available and measurable data to guide precise tactical decisions with controllable levers. Every consumer marketer understands the importance of balancing LTV and offer optimization. Our goal in developing this framework is to give decision-makers a clear set of insights and decision criteria to make the best decisions for their brands and products.
As organizations mature, data-driven offer optimization becomes part of their DNA. Added sophistication in strategic pricing over time allows for further optimization by customer segment, geography, and product portfolio management.