


By: Ian Fitton, & Brendan Meany
Published in August 2018
This article contains case studies based around Mather Economics reporting on call center effectiveness. To read more about some widely used performance statistics and other practices, check out Call Center Analytics & Revenue Yield: The Missing Link.
Also, for further information on the projects below and other similar projects, see Mather’s presentation from our 2017 Symposium: Customer Service Audit – Leveraging Data Analysis to Improve Call Center Effectiveness.
CASE STUDY
We have worked with many clients to test and establish new, more profitable call-center strategies. Here, we include example use-cases from two publishers hoping to retain more value from their price increase strategies by improving training techniques as well as optimizing discount offers in their call centers.
There are some general ways that many of our clients have used our reporting framework to create positive changes in their organizations.
Review individual representative’s performance
By including rep-specific factors such as stop rate and net to gross ratio* amongst fielded calls, representatives and managers can monitor individual performance. This helps to identify best practices, techniques, and characteristics of strong performers, and this information can be used to better train weaker performers.
There are many ways to gauge a representative’s performance. Perhaps the simplest is to review the general call results categorically (accepted full price increase, accepted no price increase, stopped subscription, etc.)
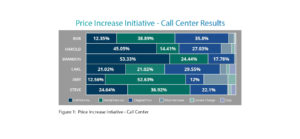
However, that may not always tell the whole story. In figure 2, Carl seems to outperform Amy since a much higher percentage of subscribers remained at their suggested price increase. However, Amy has kept a larger overall percentage of subscribers paying more than their previous price (Full Price Increase + Partial Price Increase). How do we know which strategy has the most impact on revenue?
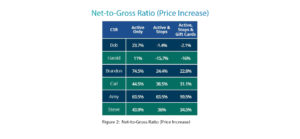
To determine performance, it is important to understand the magnitude of the given discounts. The net to gross ratio gives us the ratio of the actual amount paid in comparison to the original price increase that was offered. There are many ways to factor in other costs (such as stops, incentives such as gift cards, etc.) as shown in figure 3. Here we see that, across the board, Amy has done a good job retaining the most value.
Furthermore: of the subscribers that remain active, Brandon retains a large portion of their price increases (74.5%), but when factoring in customers who stop and are offered incentives, he falls behind (<25%). It could be inferred that Brandon offers perhaps too little of discounts, causing stop loss, and might offer incentives more freely.
In some cases, groups will pair high-performing representatives with lower-performers for further training, or closely monitor the call transcripts of representatives identified as lower-performers to find areas of improvement. In other cases, we have seen that newer representatives perform better than more experienced ones on average for various reasons.
Review individual call center performance
Oftentimes, different types of customers call in depending on their region, publication, etc. and this allows for an independent review of overall call center performance.
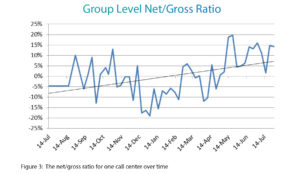
In figure 1 to the left, there is an improved net to gross ratio over time for this particular call center, showing the group’s progress.
A/B Testing & Offer Optimization
For one publisher, we performed an A/B test to gauge the optimal suggested offer rate for subscribers who call in to complain about a recent price increase. For this publisher, the groups were divided to either:
- Offering a subscriber the ability to revert to 80% of their price increase amount. If this was not sufficient, offer a 50%
- Offering a subscriber the ability to revert to 60% of their price increase amount. If this was not sufficient, offer a 30%
For example, if a subscriber was given a price increase from $5/wk to $6/wk and placed in the 80%-50% test group when calling in, they would have been offered $5.80. If that price was not accepted, the representative was to offer $5.50 as a final rate. Similarly, if they were placed into the 60%-30% group, they would first be offered $5.60—and if necessary, representatives could also offer a price of $5.30.
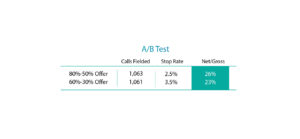
Results showed that both groups behaved similarly, and that the 60%-30% group performed slightly worse. That is to say the more stringent policy did not have an adverse effect on circulation or revenue. This was identified as an opportunity for revenue increase by more widely offering this discount level.
For solely the test group, it was estimated that a smaller discount resulted in over $230 in weekly revenue savings. Extrapolated to all incoming calls, this could amount to thousands of dollars per week.
Combined with CLV
There are also other ways to enhance call center effectiveness, by leveraging Customer Lifetime Value scores in customer profiles. In short, these scores are assigned based on a customer’s projected bottom-line dollar value over the course of their subscription.
For one publication, we implemented a discount offer table that gave larger discounts off of price increases to higher CLV subscribers (65-85% discount) in order to maximize retention, while giving less of a discount to lower-CLV subscribers (0-50% discount). These were shown as offer suggestions to the representative when a customer called in, and are listed below under “intelligent fallback offers” vs. the previous year’s “business as usual” group. Both groups were given the same average price increase.
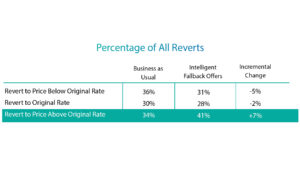
In the table to the left, the percentage of reverts shifted towards revert-above, meaning this publisher was able to capture at least a portion of the pricing revenue for a greater fraction of subscribers. Alongside this improvement was an upward shift in overall Net to Gross Ratio, which increased by 4%, meaning a larger portion of the price increase was realized in the bottom line.
To review, there are a multitude of ways that organizations can leverage call centers more effectively, and the measurement and testing of new approaches can have significant revenue implications.
However, that may not always tell the whole story. In figure 2, Carl seems to outperform Amy since a much higher percentage of subscribers remained at their suggested price increase. However, Amy has kept a larger overall percentage of subscribers paying more than their previous price (Full Price Increase + Partial Price Increase). How do we know which strategy has the most impact on revenue?
To determine performance, it is important to understand the magnitude of the given discounts. The net to gross ratio gives us the ratio of the actual amount paid in comparison to the original price increase that was offered. There are many ways to factor in other costs (such as stops, incentives such as gift cards, etc.) as shown in figure 3. Here we see that, across the board, Amy has done a good job retaining the most value.
*Net to Gross Ratio can be calculated in many ways. In this case, it is the ratio of the effective increase (adjusted on call) divided by the original increase suggested