Mexico City | July 7, 2021 FOR IMMEDIATE RELEASE WAN-IFRA Press Release WAN-IFRA, THE GOOGLE NEWS INITIATIVE AND MATHER ECONOMICS LAUNCH COMPREHENSIVE LATIN AMERICA SUBSCRIPTIONS REPORT WAN-IFRA, the Google … Read more
Mexico City | July 7, 2021 FOR IMMEDIATE RELEASE WAN-IFRA Press Release WAN-IFRA, THE GOOGLE NEWS INITIATIVE AND MATHER ECONOMICS LAUNCH COMPREHENSIVE LATIN AMERICA SUBSCRIPTIONS REPORT WAN-IFRA, the Google … Read more

Posted Tuesday, May 11, 2021 11:03 am Rob Williams | MediaPost READ MORE Digital-only subscriptions to local newspapers will overtake print subscriptions by 2027 at the latest as reading habits continue to shift to … Read more

By Matt Lindsay and Matthew Lulay | 12 April 2021 INMA Satisfying Audiences Blog Subscription yield management, which includes pricing strategy as well as tactics related to audience revenue growth, … Read more

Magazine Media are in the throes of building, expanding and optimizing their reader revenue businesses. Some magazine companies and many news media companies are already driving millions of dollars in … Read more
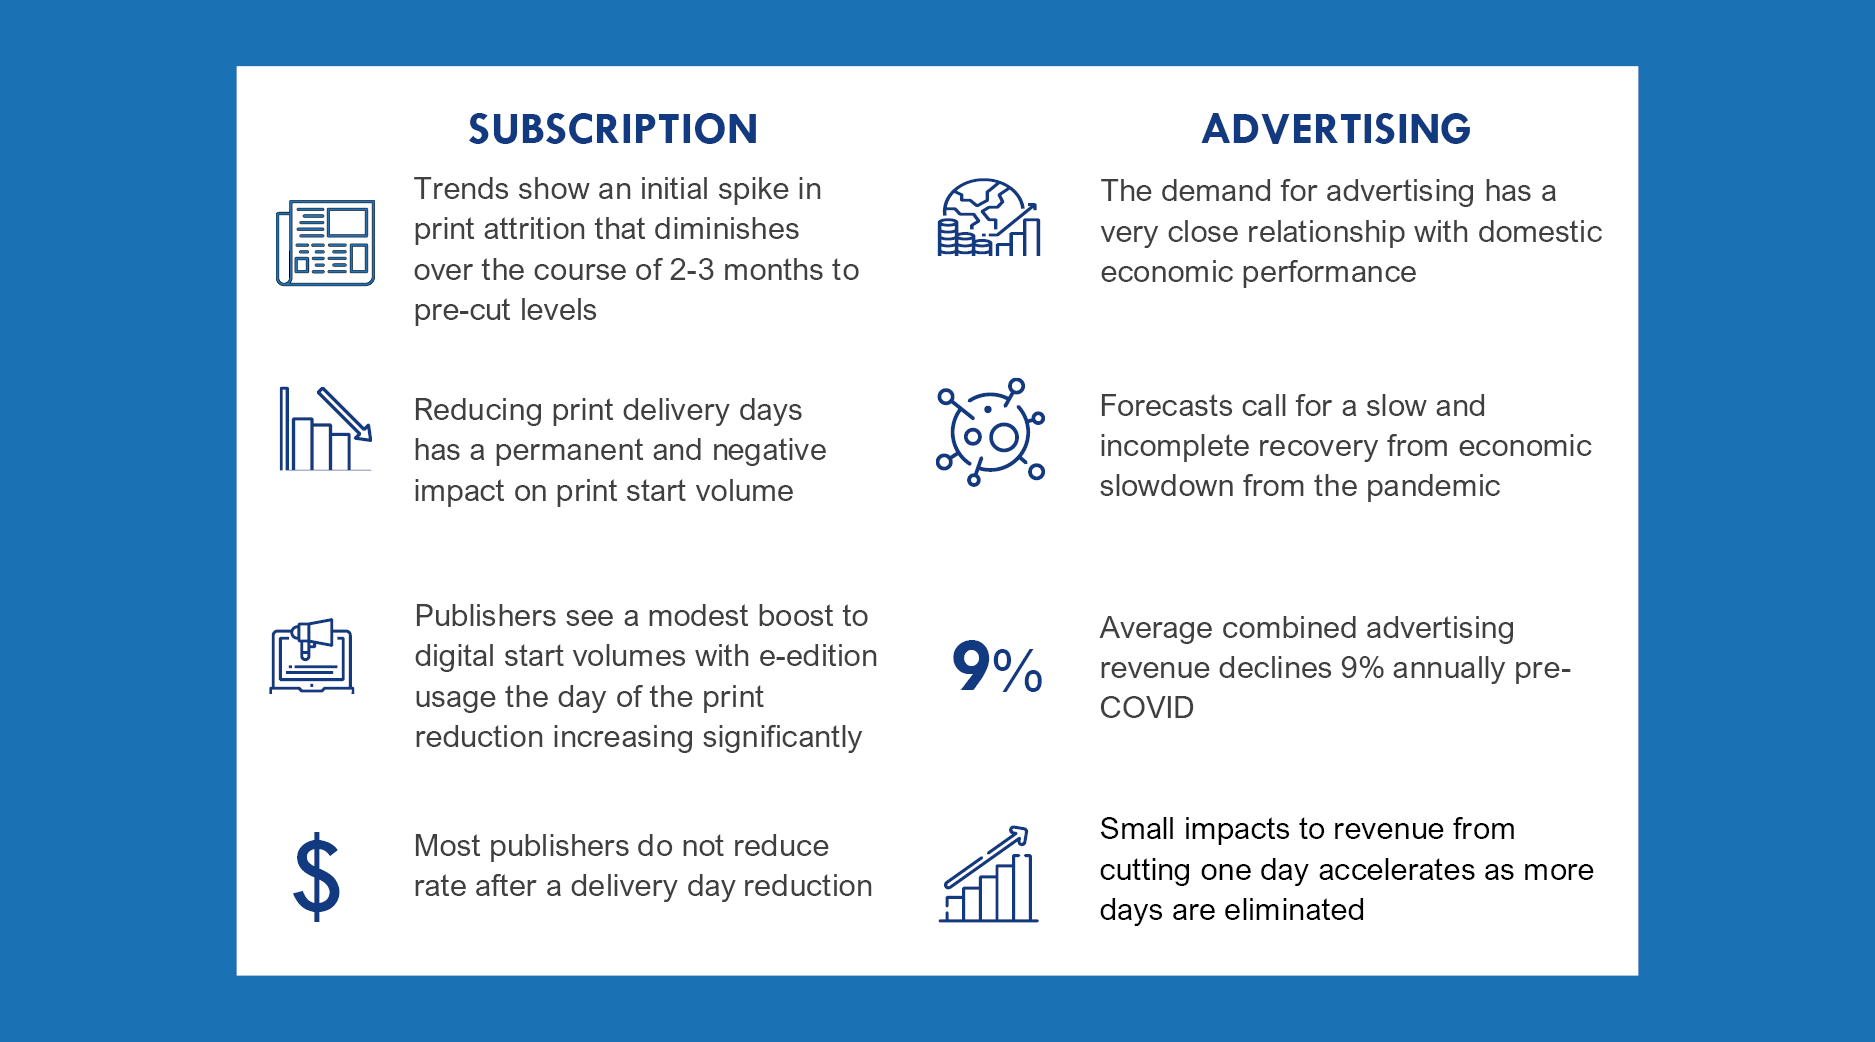
Mather Economics followed the trends of digital subscriptions and reader retention throughout the COVID-19 pandemic. Here is a look back at their 2020 insights. By Matt Lindsay | 28 December … Read more
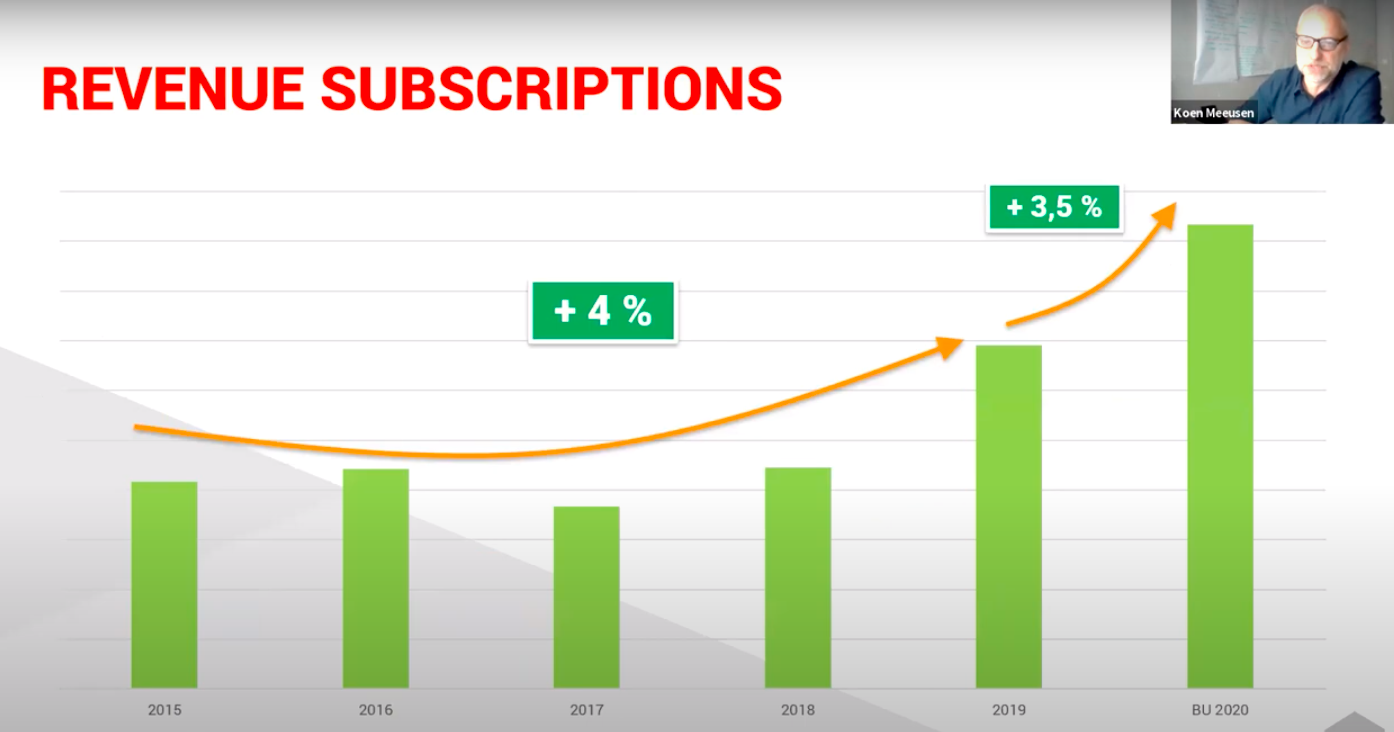
WAN- IFRA December 1st, 2020 By Brian Veseling LINK TO ARTICLE In the past five years, Mediahuis Belgium has grown the number of their digital subscribers by 85,000, more than … Read more

INMA Satisfying Audiences Blog | 01 December 2020 By Matt Lindsay A Discussion with Matthijs van de Peppel of NRC on their recent all-time subscriber level milestone Matthijs van de … Read more
INMA Audience Blog By Matt Lindsay, President of Mather Economics Why, why, why? When we work with publishers on pricing strategy, it is quickly apparent that most subscribers do not … Read more

By Mark Jacob, Northwestern | Medill Link to Article Two major news industry organizations, McClatchy and Mather Economics, have signed on to the new Medill Subscriber Engagement Index, a tool … Read more